This page has been archived on the Web.
Departmental Performance Report 2011–2012
Download as PDF (416 KB)
Table of Contents
Minister's Message

As the minister responsible for the Canada School of Public Service (the School), I am pleased to present the School's 2011-12 Departmental Performance Report. The full document is available at www.myschool-monecole.gc.ca.
As stated by the Clerk of the Privy Council in his most recent report to the Prime Minister, there is a need to build a stronger and adaptable public service that is able to meet the needs of the future. This reconfirms the crucial and continuing job that the School has in supporting and developing the public service. The School offers a range of relevant and high-quality learning products and services in line with government priorities so that departments and agencies are able to serve Canadians wherever they may be located.
This year, the School's management agenda has been successful in ensuring that the School's curriculum is affordable and responsive to the needs of the evolving public service. The School is uniquely positioned to offer relevant, timely products and services that are aligned to meet today's priorities and tomorrow's needs. Moving forward, the School will continue to emphasize collaboration and partnerships to achieve government-wide efficiencies. The School is the learning organization of choice to support the federal public sector.
I am confident that the School's capacity to deliver well-managed and efficient programming will continue to support the public service in serving Canadians with excellence.
Original version signed by:
The Honourable Tony Clement
President of the Treasury
Minister for the Federal Economic Initiative for Northern Ontario
Section I: Organizational Overview
Raison d'être
The Canada School of Public Service (the School) is the common learning service provider for the Public Service of Canada. The School has a legislative mandate to provide a range of learning activities to build individual and organizational capacity and management excellence within the public service.
The School has one strategic goal, to ensure public servants have the common knowledge and leadership and management competencies required to effectively serve Canada and Canadians.
Responsibilities
Established on April 1, 2004, under the Public Service Modernization ActEndnotes i operating under the authority of the Canada School of Public Service ActEndnotes ii (CSPS Act), the School's primary responsibility is to provide a wide range of learning opportunities and develop a learning culture within the public service. The School has a direct effect on service to Canadians by contributing to the skills development of public service employees and the effectiveness of public service organizations.
As a departmental corporation, the School is mandated under the CSPS Act to:
- encourage pride and excellence in the public service;
- foster a common sense of purpose, values and traditions in the public service;
- support deputy heads in meeting the learning needs of their organizations; and
- pursue excellence in public management and administration.
The School's program priorities are geared to delivering results in accordance with the Treasury Board's
Policy on Learning, Training and DevelopmentEndnotes iii (the Policy), which came into effect on January 1, 2006. The Policy highlights the value of learning, with particular emphasis on required training and the importance of creating a learning culture within the public service.
The School supports deputy head accountabilities with respect to leadership and professional development across the public service by identifying organizational needs and designing and delivering high-quality and practical programs that address the key development needs of public service employees.
As a common service organization under the Treasury Board's Common Services PolicyEndnotes iv,the School's curriculum is designed to support public service accountabilities and to respond to leadership competencies and government priorities. As an optional service provider, the School responds to the needs of the public service in the most efficient and effective manner possible.
The School supports Public Service Renewal and its Excellence Agenda by contributing to the renewal of the workforce and workplace by offering a broad suite of courses to incrementally advance the agenda.
Strategic Outcome and Program Activity Architecture
The School has a single strategic outcome: " Public servants have the common knowledge and the leadership and management competencies they require to fulfil their responsibilities in serving Canadians. " Four program activities support this strategic outcome:
- Foundational Learning
- Organizational Leadership Development
- Public Sector Management Innovation
- Internal Services
The chart below illustrates the Canada School of Public Service's complete framework of program activities, sub-activities and sub-sub-activities, which roll up and contribute to progress in achieving the strategic outcome.

Text version
Image of the Canada School of Public Service's Program Activity Architecture.
The School has a single strategic outcome: Public servants have the common knowledge and the leadership and management competencies they require to fulfil their responsibilities in serving Canadians.
The School has four program activities: 1. Foundational Learning; 2. Organizational Leadership Development; 3. Public Sector Management Innovation; and 4. Internal Services.
The sub-activities and sub-sub-activities are as follows:
1.1 Required Training
1.1.1 Orientation to the Public Service
1.1.2 Authority Delegation Training
1.2 Professional Development Training
1.2.1 Functional Communities Programming
1.2.2 Professional Development Programming
1.3 Official Languages Learning
1.3.1 Access to Language Training Services
1.3.2 Language Retention Services
1.4 Online Learning
1.4.1 Online Course Program
1.4.2 Online Collaborative Technology Program
2.1 Leadership Competencies
2.2 Leadership Development Programs
2.3 Leadership Community Building
3.1 Organizational Learning Services
3.2 Innovative Management Practices
4.1 Governance and Management Support
4.1.1 Management and Oversight
4.1.2 Communications
4.1.3 Legal
4.2 Resource Management Services
4.2.1 Human Resource Management
4.2.2 Financial Management
4.2.3 Information Management
4.2.4 Information Technology
4.2.5 Travel and Other Administrative Services
4.3 Asset Management Services
4.3.1 Real Property
4.3.2 Material
4.3.3 Acquisition
Organizational Priorities
Summary of Progress Against Priorities
Organizational Priorities: Summary of Progress Against Priorities. The first row displays the Priority, Type of Commitment and Strategic Outcome and/or Program Activities.
The second row displays the Priority "Strengthening Curriculum", Type of Commitment: "Previous Commitment", Strategic Outcome and list of program activities. The third row displays the description."
| Priority |
TypeFootnotes 1 |
Strategic Outcome and/or Program Activity(ies) |
| Strengthening Curriculum |
Previous commitment |
Strategic Outcome: Public servants have the common knowledge and the leadership and management competencies they require to fulfil their responsibilities in serving Canadians.
- Program Activity: Foundational Learning
- Program Activity: Organizational Leadership Development
- Program Activity: Public Sector Management Innovation
- Program Activity: Internal Services
|
- In 2011-12, the School established a new Business Model with the development of a new costing structure. The foundational work, including the review of best practices and allocation of direct and indirect program spending (including costs associated with internal services), was completed. As a result, the School has a more complete understanding of both the costs and revenues associated with its learning products and services and an enhanced ability to make strategic decisions regarding its offerings.
- In order to be well positioned to provide quality learning services, adapt quickly and ensure adequate capacity to meet evolving learning needs, the School advanced its efforts to recruit skilled instructors with experience working in the public sector.
- The School established a systematic review process of its learning products and services to align its curriculum priorities with its mandate and to ensure that its offerings remain responsive to the evolving learning needs of the public service.
|
Organizational Priorities: Summary of Progress Against Priorities. The first row displays the Priority, Type of Commitment and Strategic Outcome and/or Program Activities. The second row displays the Priority "Building Partnerships", Type of Commitment: "New", the related Strategic Outcome and list of program activities. The third row displays the description."
| Priority |
Type |
Strategic Outcome and/or Program Activity(ies) |
| Building Partnerships |
New |
Strategic Outcome: Public servants have the common knowledge and the leadership and management competencies they require to fulfil their responsibilities in serving Canadians.
- Program Activity: Foundational Learning
- Program Activity: Organizational Leadership Development
- Program Activity: Public Sector Management Innovation
- Program Activity: Internal Services
|
- In order to ensure that the School's learning services reflect the latest innovations and research relevant to the public service, the School focused on building partnerships with universities and other government departments through a number of activities, including the Public Servant-in-Residence Program and the Deputy Minister University Champion initiative.
- The School collaborated on a foresight research project with Policy Horizons Canada on the future dimensions of the public service that will support the School's ability to develop and enhance its curriculum.
- Building on its existing collaborative activities, the School developed a Learning Practitioners Community of Practice in an effort to build partnerships and promote intra-governmental information sharing of learning approaches, challenges and tools.
- The development of the School's change management learning products and services involved close collaboration with a number of organizations, including: the Office of the Chief Human Resources Officer, the Public Service Commission and the Human Resources Council.
- The School hosted its first Learning Agora, engaging key players in learning, leadership development and talent management to build partnerships, exchange ideas and provide input on the School's current and future curriculum. The event also allowed the School to gather information that was used to support the development and refinement of its products and services.
|
Organizational Priorities: Summary of Progress Against Priorities
The first row displays the Priority, Type of Commitment and Strategic Outcome and/or Program Activities. The second row displays the Priority: "Management of Change", Type of Commitment: "New", related Strategic Outcome and list of program activities. The third row displays the description."
| Priority |
Type |
Strategic Outcome and/or Program Activity(ies) |
| Management of Change |
New |
Strategic Outcome:Public servants have the common knowledge and the leadership and management competencies they require to fulfil their responsibilities in serving Canadians.
- Program Activity: Foundational Learning
- Program Activity: Organizational Leadership Development
- Program Activity: Public Sector Management Innovation
- Program Activity: Internal Services
|
- The School established an Integrated Human Resources and Financial Planning Process to enhance the consistency of its business planning process, including the establishment of strategic priorities, identification and allocation of resources and the monitoring of results against approved plans.
- In an effort to ensure the reliability, performance and rationalization of the School's Integrated Learning Management System (I-LMS), a comprehensive tool designed to support learning products and services, the School established processes to facilitate the identification of tools to meet the needs of designers and learners. The showcasing of new technologies pertinent to the future of learning, including the piloting of new software and technology configurations in the classroom, was also initiated during this time.
- The School initiated a comprehensive review of its Strategic Outcome, Program Activity Architecture and Performance Measurement Framework. The foundational work to streamline the organization's performance reporting structure, expected results and performance measures was undertaken in order to align the School's activities to its core mandate and strategic outcome.
|
Risk Analysis
As a departmental corporation, the School's operating environment is shaped by the fiscal challenges associated with increasingly operating on a cost-recovery basis. In 2011-12, more than half of the School's operating budget was funded through its revenue generation. As an optional learning services provider for the public service, the School must generate sufficient revenue from departmental training investments in order to adequately sustain its learning services and ongoing operations. In addition, the significant and rapid changes facing the public service requires the School to identify new and innovative ways to quickly adapt its existing products and services and develop new offerings to meet evolving learning needs.
Based on these environmental trends, in 2011-12, the School identified and documented in its Corporate Risk Profile three strategic risk areas that have to be managed to enable it to achieve its strategic outcome: the relevance of the School's curriculum and the delivery of its products and services; the marketing of its products and services and growing its market share; and ensuring an adequate capacity to be responsive to client needs and support the School's programs in a timely manner.
To mitigate these strategic risks, the School's risk mitigation strategy and related action plans were embedded in its management agenda, which defined the following priorities to ensure the achievement of its strategic outcome:
- curriculum management, which focuses on renewing and updating the curriculum of courses and services in order to be more responsive to client needs;
- the development of a Business Model to establish a costing model for the various products and services;
- human resources, aligning human resource capacity to program requirements; and
- the management of change, which aims to achieve success and excellence through transformation.
Curriculum management was central to the School's management agenda in 2011-12. Throughout the year, the School proactively analysed and anticipated client needs based on market trends and emerging best practices to remain a leader among learning organizations.
The School also concentrated on maximizing its market share by promoting its value as the common learning service provider for the public service and a learning institution of choice in its ability to offer high-quality learning services. In support of this initiative, a number of activities were undertaken, including building the School's business intelligence, broadening its client engagement activities, increasing the role of technology and social media in the transmission of knowledge, building partnerships and incorporating blended learning methods to its offerings (i.e. classroom, online and module approaches).
In order to strengthen its capacity, the School developed a new Business Model, allowing the organization to renew its costing structure, inform strategic investment decisions, and identify efficiencies and opportunities for re-investment. The School also improved its Human Resources-Finance planning process and implemented staffing pools, client-centered Human Resources services realignment, classification modernization, internal training, capacity building and the strategic management of staffing. The School's I-LMS was further enhanced to provide online learning products and a collaborative learning environment. With the implementation of I-LMS , a number of change management strategies were carried out in order to mitigate the risks associated with making a complex transition from four legacy systems to one integrated system.
In 2011-12, the risk mitigation strategies and action plans embedded in the School's management agenda enabled the School to overcome the environmental pressures highlighted in its Corporate Risk Profile. The School therefore maintained the level of revenues generated from departmental training investments. In addition, the School showcased its added value through its ability to innovate and quickly adapt to emerging learning needs while remaining both relevant and affordable for public service organizations across Canada.
Summary of Performance
2011-12 Financial Resources ($ Thousands)Footnotes 2
2011-12 Financial Resources in thousands of dollars. There is a footnote included: The School's Planned Spending represents the 2011-12 Main Estimates. The School's Total Authorities includes its appropriations, actual revenues generated in 2011-12 and unspent revenues generated in 2010-11 which were carried forward to 2011-12 pursuant to section 18(2) of the CSPS Act. Read down the first column for the School's Planned Spending in 2011-2012 and then read to the right and down for Total Authorities and Actual Spending in 2011-2012. There is an important note included in the table: excludes amount deemed appropriated to Shared Services Canada, if applicable.
| Planned Spending |
Total AuthoritiesFootnotes * |
Actual SpendingFootnotes * |
| 104,949 |
160,130 |
125,941 |
2011-12 Human Resources (full-time equivalents [FTEs])
2011-2012 Human Resources Full Time Equivalents (FTEs) for the School. Read down the first column for the number of planned full-time equivalents for 2011-2012 and then read to the right and down for the number of actual full-time equivalents and then the difference between the planned and actual FTEs.
| Planned |
Actual |
Difference |
| 940 |
892 |
-48 |
Progress Toward Strategic Outcome
Summary of Performance Tables
Summary of Performance Tables, Progress Toward Strategic Outcome.
The first row displays the School's Strategic Outcome description. Read down the first column for the Performance Indicators. In the second column, read down and to the right for the Targets and Performance."
| Strategic Outcome:
Public servants having the common knowledge and the leadership and management competencies they require to fulfil their responsibilities in serving Canadians. |
| Performance Indicators |
Targets |
2011-12 Performance |
| Number of learning activities that address leadership development, management competencies and common knowledge, and number of participants. |
Approximately 900 learning activities. Approximately 220,000 learner days (number of learners/participants multiplied by the number of days in training). |
The School offered more than 800 learning activities, resulting in a total of 177,692 learner days in 2011-12. |
| Percentage of public service employees who have attended School learning activities and feel that the training provided responded to their learning needs and was a worthwhile investment for their employer. |
80 percent of learning activity participants feel that the training provided responded to their needs and was a worthwhile investment for their employer. |
In 2011-12, 82 percentFootnotes 3 of respondents reported that the training provided met their learning needs while 81 percent felt that it was a worthwhile investment for their employer. |
Performance Summary, Excluding Internal Services
Performance Summary, Excluding Internal Services Table in thousands of dollars. Read down the first column for the School's program activities: Foundational Learning, Organizational Leadership and Public Sector Management Innovation. The second column indicates the School's Actual Spending for 2010-2011 for each of the School's program activities. Read to the right and down for the School's 2011-2012 financials reported in the following categories: Main Estimates, Planned Spending, Total Authorities and Actual Spending for each program activity. The second last row displays the total for reach column. The last column of the table indicates the alignment to Government of Canada outcomes. There is an important note in that table: excludes amount deemed appropriated to Shared Services Canada, if applicable.
| Program Activity |
2010-11
Actual
Spending
|
2011-12 ($ Thousands) |
Alignment to Government of Canada Outcome |
Main
Estimates |
Planned
Spending |
Total
AuthoritiesFootnotes * |
Actual
SpendingFootnotes * |
| Foundational Learning |
72,488 |
65,977 |
65,977 |
109,353 |
74,699 |
Well-managed and efficient government operationsEndnotes v |
| Organizational Leadership Development |
17,993 |
11,108 |
11,108 |
13,394 |
12,713 |
| Public Sector Management Innovation |
10,468 |
11,303 |
11,303 |
13,535 |
8,443 |
| Total |
100,949 |
88,388 |
88,388 |
136,282 |
95,855 |
Performance Summary for Internal Services
Performance Summary for Internal Services Table in thousands of dollars. Read down the first column for Internal Services program activity. Read to the right and down for the School's Actual Spending Internal Services in 2010-2011. Read to the right and down for the School's 2011-2012 financials reported for the following categories: Main Estimates, Planned Spending, Total Authorities and Actual Spending for Internal Services. There is an important note in the table: excludes amount deemed appropriated to Shared Service Canada, if applicable.
| Program Activity |
2010-11
Actual
Spending
|
2011-12 ($ Thousands) |
Main
Estimates |
Planned
Spending |
Total
AuthoritiesFootnotes * |
Actual
SpendingFootnotes * |
| Internal Services |
27,685 |
16,561 |
16,561 |
23,848 |
30,086 |
The difference between actual spending and planned spending reflects the increase in the amount of actual revenue above planned revenue.
Strategic Environmental Assessment
During 2011-12, the School considered the environmental effects of initiatives subject to the Cabinet Directive on the Environmental Assessment of Policy, Plan and Program ProposalsEndnotes vi and did not produce any public statements.
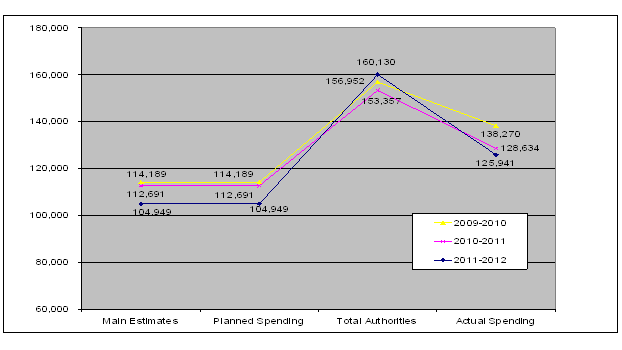
Expenditure Profile ($ Thousands)
Text version
A chart depicting the spending trends for the Canada School of Public Service from 2009-2010 to 2011-2012 in thousands of dollars. Figures are provided for the following categories: Main Estimates, Planned Spending, Total Authorities and Actual Spending.
Main Estimates:
2009-2010: $114,189
2010-2011: $112,691
2011-2012: $104,949
Planned Spending:
2009-2010: $114,189
2010-2011: $112,691
2011-2012: $104,949
Total Authorities:
2009-2010: $160,130
2010-2011: $156,952
2011-2012: $153,357
Actual Spending:
2009-2010: $138,270
2010-2011: $128,634
2011-2012: $125,941
The School's Planned Spending and Main Estimates have decreased over the last three years as a result of reductions to the School's funding from initiatives such as Strategic Review, compensation adjustments and the sunsetting of I-LMS funding. Total Authorities which include respendable revenue have increased gradually, primarily as a result of higher revenue. Actual Spending has declined mainly due to a decrease in operation and maintenance expenditures.
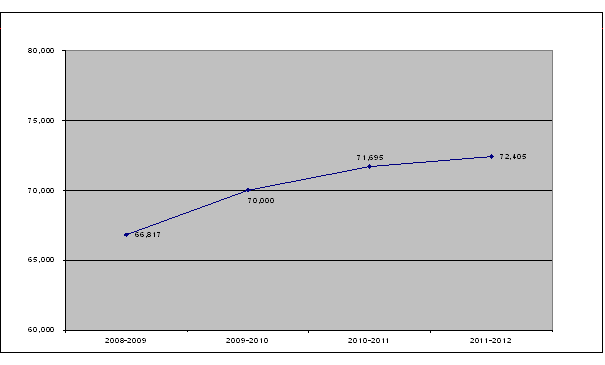
Revenues Earned ($ Thousands)
Text version
A chart depicting the increased revenue trend for the Canada School of Public Service from fiscal years 2008-2009 to 2011-2012. The figures for the four fiscal years are as follows:
2008-2009: $66,817
2009-2010: $70,000
2010-2011: $71,695
2011-2012: $72,405
Total revenue has increased gradually over the last four years, notably in the areas of Functional Community courses and Registration Services.
Estimates by Vote
For information on the Canada School of Public Service's organizational Votes and/or statutory expenditures, please see the Public Accounts of Canada 2012 (Volume II). An electronic version of the Public Accounts 2012Endnotes vii is available on the Public Works and Government Services Canada's Web site.
Section II: Analysis of Program Activities by Strategic Outcome
Strategic Outcome
The School has a single strategic outcome: " Public servants have the common knowledge and the leadership and management competencies they require to fulfil their responsibilities in serving Canadians. " Four program activities support this strategic outcome:
- Foundational Learning
- Organizational Leadership
- Public Sector Management Innovation
- Internal Services
The School was created to ensure that employees of the Public Service of Canada have the required competencies and common knowledge to serve Canadians in the most efficient and effective way possible. To achieve this goal, the School continues to offer a curriculum and services that focuses on the key skills and knowledge required by a dynamic public service that adapts to the needs of its stakeholders and Canadians. At the same time, the School relies on the consistency of its training and learning activities to ensure that public service employees have the common skills and knowledge expected of them.
Program Activity 1: Foundational Learning
Program Activity Description
The School, through its Foundational Learning program activity, contributes to building a professional workforce by providing the learning required for public service employees to serve Canadians. Four initiatives support this program activity:
- Required Training
- Professional Development Training
- Official Languages Learning
- Online Learning
2011-12 Financial Resources ($ Thousands)
2011-2012 Financial Resources table in thousands of dollars for the Foundational Learning program activity. Read down the first column for the School's Planned Spending in 2011-2012 and then read to the right and down for Total Authorities and Actual Spending in 2011-2012. There is an important note in the table: excludes amount deemed appropriated to Shared Services Canada, if applicable.
| Planned Spending |
Total AuthoritiesFootnotes * |
Actual SpendingFootnotes * |
| 65,977 |
109,353 |
74,699 |
2011-12 Human Resources (FTEs)
2011-2012 Human Resources Full Time Equivalents (FTEs) for the Foundational Learning program activity. Read down the first column for the number of planned full-time equivalents for 2011-2012 and then read to the right and down for the number of actual full-time equivalents and then the difference between the planned and actual FTEs.
| Planned |
Actual |
Difference |
| 443 |
524 |
81 |
Program Activity Performance Summary
Program Activity Performance Summary for the Foundational Learning program activity. Read down the first column for the Expected Results. Read to the right and down for the School's Performance Indicators, Targets and Actual Results.
Expected
Results |
Performance
Indicators |
Targets |
Actual Results |
| Public service employees' learning objectives are met in the foundational learning activities provided by the Canada School of Public Service. |
The School will identify the percentage of participants who intend to apply, are able to apply, and/or have applied the knowledge acquired in foundational knowledge learning activities to their current or future workplace. |
80 percent of participants are able to apply their acquired knowledge. |
In 2011-12, 87 percentFootnotes 4 of respondents felt confident in their ability to apply their learning on the job. |
Performance Summary and Analysis of Program Activity
Required Training
In accordance with the
Policy on Learning, Training and Development, the Orientation to the Public Service training provides a foundational understanding of government and the values, ethics and responsibilities that public service employees will draw upon throughout their careers. The School uses a mix of learning approaches, with a one-day classroom session complemented by prerequisite online training.
In 2011-12, the School continued its transition to a blended learning model, exploring opportunities to incorporate additional social media tools into the Orientation to the Public Service training. The School implemented recommendations put forward through its performance monitoring activities, including refining course content and improving communication with departments to ensure that new public service employees complete their orientation training in a timely manner.
Breakdown of Orientation to the Public Service Deliveries
Breakdown of Orientation to the Public Service Table. The first column displays the fiscal years 2007-2008 to 2011-2012. Read to the right and down for the number of Courses Delivered in the National Capital Region, broken down by number of offerings and number of learners. Read to the right and down for the number of Courses Delivered Regionally, broken down by number of offerings and number of learners. Read to the right and down for Total Number of Courses Delivered broken down by number of offerings and number of learners.
Fiscal
Year |
Courses Delivered in the
National Capital Region |
Courses Delivered
Regionally |
Total
Courses Delivered
|
| Offerings |
Learners |
Offerings |
Learners |
Offerings |
Learners |
| 2007-08 |
40 |
4,804 |
22 |
2,456 |
62 |
7,260 |
| 2008-09 |
55 |
5,568 |
47 |
4,916 |
102 |
10,484 |
| 2009-10 |
44 |
4,935 |
44 |
4,188 |
88 |
9,123 |
| 2010-11 |
39 |
3,417 |
48 |
3,042 |
87 |
6,459 |
| 2011-12 |
38 |
2,455 |
37 |
1,928 |
75 |
4,383 |
In accordance with the Policy on Learning, Training and Development, the School provides Authority Delegation Training to five groups of employees: supervisors, managers, new executives (EX-01), senior executives (EX-02 and EX-03) and assistant deputy ministers to ensure that these groups are equipped to exercise their delegated authorities.
As part of the School's ongoing work to refine its learning services, the School worked to maintain collaborative relationships and alignment with policy centres and functional community leads. As a result, the School negotiated several service-level agreements designed to support curriculum development and design.
During the year, the School developed a suite of online modules for the Authority Delegation Training curriculum, designed to provide learners with greater flexibility and maximize efficient use of classroom time. In accordance with the Policy on Learning, Training and Development, managers and executives must complete a knowledge assessment leading to validation of delegated signing authorities at least every five years, using the assessment instrument provided by the School. In 2011-12, the School revalidated approximately 8,765 eligible managers and executives.
Breakdown of Authority Delegation Training Deliveries
Breakdown of Authority Delegation Training Deliveries Table. The first column displays fiscal years 2007-2008 to 2011-2012. Read to the right and down for the number of Courses Delivered in the National Capital Region, broken down by number of offerings and number of learners. Read to the right and down for the number of Courses Delivered Regionally, broken down by number of offerings and number of learners. Read to the right and down for the Total Number of Courses Delivered broken down by number of offerings and number of learners.
Fiscal
Year |
Courses Delivered in the
National Capital Region |
Courses Delivered
Regionally |
Total
Courses Delivered
|
| Offerings |
Learners |
Offerings |
Learners |
Offerings |
Learners |
| 2007-08 |
178 |
4,051 |
123 |
2,616 |
301 |
6,667 |
| 2008-09 |
234 |
5,259 |
138 |
2,931 |
372 |
8,190 |
| 2009-10 |
257 |
5,891 |
157 |
3,147 |
414 |
9,038 |
| 2010-11 |
272 |
5,764 |
170 |
3,174 |
442 |
8,938 |
| 2011-12 |
229 |
4,835 |
138 |
2,450 |
367 |
7,285 |
Professional Development Training
The School designs and delivers learning products for all public service employees including Functional Communities (e.g. Information Management, Human Resources, Financial Management/Audit and Procurement, Materiel Management and Real Property) in order to provide all learners with the knowledge to perform their functions and assume their responsibilities under related legislation and policies.
As a result of the School's learning needs analyses and consultation activities with the Communications and Information Technology communities, new learning products on internal communications and Web accessibility were developed in order to meet emerging learning needs. A Level 3 evaluation, which measures the extent that a learning event has influenced behaviour in the workplace, was carried out on the new Web Accessibility course. The findings of the evaluation demonstrated that the Web Accessibility course is highly effective in changing participants' methods of working with respect to designing accessible Web sites.
Breakdown of Functional Community Deliveries
Breakdown of Functional Communities Deliveries Table. The first column displays fiscal years 2007-2008 to 2011-2012. Read to the right and down for Courses Delivered in the National Capital Region, broken down by number of offerings and number of learners. Read to the right and down for Courses Delivered Regionally, broken down by the number of offerings and number of learners. Read to the right and down for Total Courses Delivered broken down by number of offerings and number of learners.
Fiscal
Year |
Courses Delivered in the
National Capital Region |
Courses Delivered
Regionally |
Total
Courses Delivered
|
| Offerings |
Learners |
Offerings |
Learners |
Offerings |
Learners |
| 2007-08 |
358 |
7,226 |
255 |
5,647 |
613 |
12,873 |
| 2008-09 |
458 |
9,222 |
256 |
4,177 |
714 |
13,399 |
| 2009-10 |
470 |
8,794 |
281 |
3,166 |
751 |
11,960 |
| 2010-11 |
472 |
9,361 |
254 |
3,284 |
726 |
12,645 |
| 2011-12 |
496 |
10,134 |
244 |
3,247 |
740 |
13,381 |
The Finance, Procurement, Materiel Management and Real Property, and Regulatory communities worked to address regional learning needs and increase opportunities to share best practices and exchange ideas. Consultation activities resulted in positive client feedback and enhanced learning opportunities for participants. In addition, the School developed a new online risk management course designed to meet the specific learning needs of the Finance community. Two new online products were also developed to support learning related to the Directive on Recordkeeping.
Breakdown of Professional Development Deliveries
Breakdown of Professional Development Deliveries Table. The first column displays fiscal years 2007-2008 to 2011-2012. Read to the right and down for the number of Courses Delivered in the National Capital Region, broken down by number of offerings and number of learners. Read to the right and down for number of Courses Delivered Regionally, broken down by number of offerings and number of learners. Read to the right and down for total number of Courses Delivered broken down by number of offerings and number of learners.
Fiscal
Year |
Courses Delivered in the
National Capital Region |
Courses Delivered
Regionally |
Total
Courses Delivered
|
| Offerings |
Learners |
Offerings |
Learners |
Offerings |
Learners |
| 2007-08 |
305 |
6,262 |
198 |
2,792 |
503 |
9,054 |
| 2008-09 |
271 |
5,628 |
196 |
3,066 |
467 |
8,694 |
| 2009-10 |
375 |
7,686 |
261 |
3,843 |
636 |
11,529 |
| 2010-11 |
389 |
8,403 |
264 |
4,033 |
653 |
12,436 |
| 2011-12 |
507 |
10,738 |
301 |
4,382 |
808 |
15,120 |
Official Languages Learning
The School worked to refine its future role in meeting the official languages learning needs of the public service. As a result of consultations and building on the 2006 Treasury Board decision regarding the School's role in supporting language training, the School's direct delivery of language training services ceased as of March 31, 2012. With the implementation of the Treasury Board decision, the School focused on building and maintaining the official languages competencies of public service employees through several mechanisms, including establishing, implementing and monitoring quality assurance standards for pre-qualified, external language training providers; developing and providing access to online language training tools and products; conducting research on learning technologies and methodologies, including research related to addressing the learning needs of individuals with learning disabilities; and providing services related to language learning plans.
In 2011-12, the School conducted an internal audit of its language training services with the objective of assessing the adequacy of management actions to ensure that the School provides relevant, high-quality language training services that offer best value for money to departmental clients. The scope of the examination included language training and maintenance activities undertaken by the School across Canada. The findings of the internal audit concluded that the School's actions were adequate in ensuring that public service employees were offered relevant, high-quality language training services that offered best value for money.
Online Learning
In 2011-12, the School focused on leveraging the capabilities of I-LMS , a comprehensive tool designed to support learning products and services in offering a wide range of learning delivery methods, including online learning products, blended learning solutions and online communities of practice. In addition, the School initiated the implementation of a virtual collaboration and virtual classroom forum that is designed to be integrated with I-LMS , in support of public service employee learning across the country.
As part of the School's efforts to further integrate the use of technology and social media in its learning services, the organization worked to identify and develop partnerships with other government organizations interested in using I-LMS for their departmental learning needs. Over the course of the year, the School provided approximately 3,000 online commercial courses to departments and agencies on a cost-recovery basis.
Lessons Learned
In 2011-12, the School worked to integrate public service employees currently on staff in the instruction and delivery of the School's curriculum in order to capitalize on the knowledge and experience that exists within the public service. The benefits of this approach were two-fold: learner feedback demonstrated support for instructors with relevant " on the job " experience and the School was able to meet learning needs in a more cost-efficient manner. The School will continue to explore how to maximize its use of the existing knowledge and experience within the public service.
Program Activity 2: Organizational Leadership Development
Program Activity Description
The School strengthens public service capacity by building the leadership competencies of existing and emerging leaders through leadership development programs. Due to the significant focus on leadership accountabilities and the anticipated high retirement rates among employees and executives, there is continuous demand for programs that develop leaders for a modern public service in a globalized environment. Three initiatives support this program activity:
- Leadership Competencies
- Leadership Development Programs
- Leadership Community Building
2011-12 Financial Resources ($ Thousands)
2011-2012 Financial resources in thousands of dollars for the Organizational Leadership Development program activity. Read down the first column for the School's Planned Spending in 2011-2012 and then read to the right and down for Total Authorities and Actual Spending in 2011-2012. There is an important note included the table: excludes amount deemed appropriated to Shared Services Canada, if applicable.
| Planned Spending |
Total AuthoritiesFootnotes * |
Actual SpendingFootnotes * |
| 11,108 |
13,394 |
12,713 |
2011-12 Human Resources (FTEs)
2011-2012 Human Resources Full Time Equivalents (FTEs) for the Organizational Leadership Development program activity. Read down the first column for the number of planned full-time equivalents for 2011-2012 and then read to the right and down for the number of actual full-time equivalents and then the difference between the planned and actual FTEs.
| Planned |
Actual |
Difference |
| 102 |
92 |
-10 |
Program Activity Performance Summary
Program Activity Performance Summary for the Organizational Leadership Development. Read down the first column for the Expected Results. Read to the right and down for the School's Performance Indicators, Targets and Actual Results.
Expected
Results |
Performance
Indicators |
Targets |
Actual Results |
| Public service managers, executives and senior leaders are satisfied with the leadership development courses, programs and activities received. |
The School will measure the degree of satisfaction of public service employees with the leadership activities provided. |
Leadership activities receive an average rating of 4 on a 5-point scale on overall satisfaction. |
In 2011-12, leadership activities received an overall satisfaction rating of 4.41 on a 5-point scale. |
| Public service managers, executives and senior leaders are able to apply their leadership competencies in the workplace. |
The School will determine the percentage of public service employees who intend to apply, are able to apply and/or have applied the knowledge acquired through leadership development activities in their workplace. |
80 percent of participants are able to apply their acquired knowledge. |
In 2011-12, 90
percent of respondents felt confident in their ability to apply the learning on the job. |
Performance Summary and Analysis of Program Activity
The new generation of leaders in the public service are facing added pressures as they move into leadership roles more quickly than their predecessors. Organizations are also seeking to invest in leadership development in cost-efficient ways. The School continues to respond to departmental needs by supporting leaders and equipping them with the skills required to achieve results for Canadians. The School's Level 1 evaluation measures client satisfaction with the School's learning products and whether participants' learning objectives were met. In 2011-12, the leadership curriculum evaluation results were the highest achieved to date.
Breakdown of Leadership Program Deliveries
Breakdown of Leadership Program Deliveries Table. Read down the first column for the fiscal years 2007-2008 to 2011-2012. Read to the right and down for the number of Courses Delivered in the National Capital Region, broken down by number of offerings and learners. Read to the right and down for number of Courses Delivered Regionally, broken down by number of offerings and learners. Read to the right and down for total number of Courses Delivered broken down by number of offerings and number of learners.
Fiscal
Year |
Courses Delivered in the
National Capital Region |
Courses Delivered
Regionally |
Total
Courses Delivered
|
| Offerings |
Learners |
Offerings |
Learners |
Offerings |
Learners |
| 2007-08 |
145 |
2,051 |
13 |
166 |
158 |
2,217 |
| 2008-09 |
103 |
2,666 |
38 |
182 |
141 |
2,848 |
| 2009-10 |
170 |
3,027 |
35 |
148 |
205 |
3,175 |
| 2010-11 |
140 |
2,483 |
23 |
377 |
163 |
2,860 |
| 2011-12 |
98 |
1,561 |
23 |
371 |
121 |
1,932 |
In 2011-12, the School offered shorter and sharper learning interventions in addition to training related to change management. As a result of consultations with departments and agencies, leadership offerings were adapted, reflecting more targeted and cost-effective learning solutions. Through the development of partnerships with regional councils and provincial governments, the leadership for aspiring managers program (ileadership) was offered regionally for the first time which resulted in cost savings while facilitating access to the School's learning services across Canada.
The School delivered its change management learning services through a number of delivery forums, including seminar series and armchair discussions. Examples include a two-day workshop for executives, The Core of Change Management, and a one-day workshop for employees, Navigating through Change, which were developed and delivered in over 15 departments to over 800 employees.
In 2011-12, the School hosted the Manion Lecture, the School's marquee event which aims to broaden public service employees' horizons, encourage thoughtful debate on key issues and provide an opportunity to network. Sir Gus O'Donnell, Cabinet Secretary and Head of the Civil Service of the United Kingdom, shared his insights about how the British government operates within today's challenging economic climate. Participation was high at this event with over 500 executives and leaders from Canadian universities and the federal government in attendance.
Lessons Learned
In 2011-12, the School launched a series of special seminars on change management and transition, beginning with the most senior levels within the public service. Over 2,900 participants attended the special seminars tailored for public service leaders. Based on positive feedback, the School responded with a cascading series of offerings geared towards executives, managers and Human Resources practitioners. Both the level of demand and the positive feedback received demonstrated the benefits of a consistent and integrated approach to training across the public service as well as the School's ability to respond to evolving learning needs at all levels.
Program Activity 3: Public Sector Management Innovation
Program Activity Description
The School enhances the performance of the public service by disseminating innovations and leading practices in public management and providing public service organizations with advice and support regarding learning and change management. Two initiatives support this program activity:
- Organizational Learning Services
- Innovative Management Practices
2011-12 Financial Resources ($ Thousands)
2011-2012 Financial resources in thousands of dollars for the Public Sector Management Innovation program activity. Read down the first column for the School's Planned Spending in 2011-2012 and then read to the right and down for Total Authorities and Actual Spending in 2011-2012. There is an important note included the table: excludes amount deemed appropriated to Shared Services Canada, if applicable.
| Planned Spending |
Total AuthoritiesFootnotes * |
Actual SpendingFootnotes * |
| 11,303 |
13,535 |
8,443 |
2011-12 Human Resources (FTEs)
2011-2012 Human Resources Full Time Equivalents for Public Sector Management Innovation. Read down the first column for the number of planned full-time equivalents for 2011-2012 and then read to the right and down for the number of actual full-time equivalents and then the difference between the planned and actual FTEs.
| Planned |
Actual |
Difference |
| 77 |
60 |
-17 |
Program Activity Performance Summary
Program Activity Performance Summary for the Public Sector Management Innovation program activity. Read down the first column for the Expected Results. Read to the right and down for the School's Expected Results, Performance Indicators, Targets and Actual Results.
Expected
Results |
Performance
Indicators |
Targets |
Actual Results |
| Public service organizations have access to tools and services to help them integrate learning, manage change and innovate. |
The School will track the number of organizations provided with Public Sector Management Innovation services. |
25 departments and agencies provided with Public Sector Management Innovation services. |
In 2011-12, the School provided Public Sector Management Innovation services to 40 departments and agencies. |
| Public service organizations integrate learning, manage change and innovate by adapting best practices. |
The School will measure the degree of satisfaction of public service organizations with the School's Public Sector Management Innovation services. |
A satisfaction rate of 80 percent. |
The School is currently developing a methodology for the evaluation of this performance indicator. |
Performance Summary and Analysis of Program Activity
In 2011-12, the School facilitated a number of international projects funded by the Canadian International Development Agency (CIDA) to promote knowledge transfer and innovative management development, in areas such as leadership training and governance capacity building. Examples include the following:
- Mali Project: a multi-year capacity strengthening initiative delivered in partnership with the Mali Auditor General Office, the Office of the Auditor General of Canada and CIDA.
- Ukraine Project: a CIDA-funded initiative with the Canadian Bureau of International Education with the objective of assisting the Main Department of the Civil Service in developing the Leadership Development Program for Deputy Ministers of the Government of Ukraine.
- Caribbean Leadership Project: a CIDA-funded initiative with the objective of strategically strengthening the next generation of Caribbean public sector leaders and sharing best practices, in an effort to contribute to their regional and national development goals, including regional integration and economic growth.
The School hosted foreign delegations from a number of government institutions with the objective of sharing good governance practices. The School also collaborated with the Netherlands' Office of the Senior Civil Service, Ministry of the Interior and Kingdom Relations on the design and delivery of the Global Engagement Network.
The School collaborated with other nations on the New Synthesis Project, an international partnership of institutions committed to advancing the study and practice of public administration. This project was led by the School's President Emeritus, the Honourable Jocelyne Bourgon, and resulted in an in-depth publication entitled A New Synthesis of Public Administration: Serving in the 21st Century,detailing the project and the case studies that contributed to its development. The findings of the report have also been used to enhance the School's learning products and services.
In support of its mandate to promote excellence in public management and administration, the School's Innovative Public Management Research Fund contribution program successfully concluded in 2011-12. Over its six-year period, the program supported universities and other public sector non-governmental institutions undertaking research and training aligned with public service priorities.
In support of leadership development, the School undertook a number of talent management initiatives over the course of the year, including:
- the delivery of organization development interventions to 40 departments and agencies;
- the delivery of over five hundred 360° Assessments to employees in more than 10 departments and agencies; and
- individual coaching to employees in over 20 departments and agencies.
As part of the School's efforts to support the Government of Canada's priorities and meet the learning needs of the public service in a time of transition, the School provided customized interventions for federal organizations with a particular focus on departmental change management needs, including areas such as leadership support and development and team effectiveness.
Lessons Learned
The offering of more customized learning services that are both relevant and adaptable has proven to be of benefit to learners at all levels of the public service. As a result, the School will work to develop a modular approach to course content to tailor its services to specific learning needs, with particular emphasis on managing change in a time of transition.
The success of the School's first Learning Agora demonstrated the benefit of engaging senior leaders on emerging issues. As a result, the School gained a better understanding of departmental learning needs which will serve to support the future direction of the School's curriculum and shape future leader engagement activities.
Program Activity 4: Internal Services
Internal Services are groups of related activities and resources that are administered to support the needs of programs and other corporate obligations of an organization.Footnotes 5 Internal Services include only those activities and resources that apply across an organization and not to those provided specifically to a program.
2011-12 Financial Resources ($ Thousands)
2011-2012 Financial resources in thousands of dollars for the Internal Services program activity. Read down the first column for the School's Planned Spending in 2011-2012 and then read to the right and down for Total Authorities and Actual Spending in 2011-2012. There is an important note included in the table: excludes amount deemed appropriated to Shared Services Canada, if applicable.
| Planned Spending |
Total AuthoritiesFootnotes * |
Actual SpendingFootnotes * |
| 16,561 |
23,848 |
30,086 |
The School's expenditures related to Internal Services, including Human Resources, are dependent on the amount of revenue and learner registrations generated by the organization. The differences between planned and actual spending reflect the increase in the amount of revenue generated above the planned amount by the School.
2011-12 Human Resources (FTEs)
2011-2012 Human Resources Full Time Equivalents for the Internal Services program activity. Read down the first column for the number of full-time equivalents planned for 2011-2012 and then read to the right and down for the number of actual full-time equivalents and then the difference between the planned and actual FTEs.
| Planned |
Actual |
Difference |
| 318 |
216 |
-102 |
Performance Summary and Analysis of Program Activity
Performance Summary and Analysis of Program Activity. The first column lists projects and initiatives under the Internal Services program activity. Read to right and down for the status on performance and results for each project.
| Projects/Initiatives |
Status on Performance and Results |
| 1. Human Resources Plan |
The School offered a variety of learning opportunities, including the opportunity to participate in an online Learning Practitioners Community of Practice. A discussion forum and several training sessions were also organized to ensure that the School's employees are equipped with the knowledge necessary to make comprehensive use of the School's new technologies.
The School developed a Human Resources management framework as part of its ongoing efforts to capitalize on the knowledge and expertise that exists within the public service. |
| 2. Business ModelFootnotes 6 |
The School created a new Business Model with the development of a new costing structure for the organization. The foundational work was completed, including the review of best practices and the allocation of direct and indirect program spending, in addition to the costs associated with internal services.
In support of the School's new Business Model, communications strategies and training opportunities were initiated and designed to continue on an ongoing basis in an effort to keep the Business Model current and relevant. |
| 3. Complete Implementation of
I-LMS |
The School made progress in its efforts to complete the implementation of I-LMS , resulting in improved registration, performance and reporting. Efforts were made to promote I-LMS as a collaborative tool for the public service. The School also began on-boarding of select departments. |
| 4. Optimizing and Standardizing the School's IT Infrastructure |
The School further optimized and standardized the School's IT infrastructure. The organization also worked in partnership with Shared Services Canada to align the IT infrastructure with program priorities while leveraging the School's IT assets within the classroom. |
| 5. Document and Information Management |
The School began the phased implementation of GCDOCS, a new information management system which will provide better organization and access to information and facilitate collaboration throughout the School. GCDOCS will replace all other information management systems across the government. The School is on schedule to meet its implementation timeline of 2014. |
| 6. Optimizing Office Space |
The School continued to implement its accommodation strategy which included consolidating its office space from six buildings to three in the National Capital Region, in order to seek efficiencies and optimize classroom use. |
Lessons Learned
In 2011-12, the School continued to transition to an operating environment with greater emphasis on cost recovery. The School therefore has continued to make appropriate adjustments to both its learning services and internal operations in order to adequately respond to emerging learning needs while seeking efficiencies in its operations.
The School's ability to collect performance measurement data poses an ongoing challenge for the organization. The School continues to examine its data collection and reporting in order to ensure its relevance in assessing both performance and targets.
Changes to Government Structure
Impacts on Financial and Human Resources Resulting from the Establishment of Shared Services Canada
2011-12 Financial Resources ($ Thousands)
Changes to Government Structure: Impacts on Financial and Human Resources Resulting from the Establishment of Shared Services Canada Table. 2011-2012 Financial resources in thousands of dollars. Read down the first column for the category "net transfer post Orders in Council (OIC) to Shared Services Canada (SSC). Read to the right and down for the School's Planned Spending and Total Authorities in 2011-2012. There are two important notes included in the table:
* Pursuant to section 31.1 of the Financial Administration Act and Orders in Council P.C. 2011-0881, P.C. 2011-0877 and P.C. 2011-1297, this amount was deemed to have been appropriated to SSC, which resulted in a reduction in the appropriation for the Canada School of Public Service.
** Total authorities, as presented in the "2011-12 Financial Resources" table (and other relevant tables) in the "Summary of Performance" section, is the net of any transfers to SSC. Actual spending does not include expenditures incurred on behalf of SSC as of the OIC date."
| blank |
Planned Spending |
Total AuthoritiesFootnotes ** |
Net transfer post Orders in Council (OIC)Footnotes ***
to Shared Services Canada (SSC) |
1,140 |
1,140 |
2011-12 Human Resources (FTEs)
Changes to Government Structure -Impacts on Financial and Human Resources Resulting from the Establishment of Shared Services Canada. 2011-2012 Human Resources Full Time Equivalents deemed to Shared Services Canada. Read to the right and down for the number of planned full-time equivalents for 2011-2012 and then read to the right and down for the number of actual full-time equivalents deemed to Shared Services Canada (SSC).
| blank |
Planned |
Actual |
| Deemed to SSC |
2.3 |
2.3 |
Section III: Supplementary Information
Financial Highlights
Condensed Statement of Financial Position (Unaudited)
As of March 31, 2012
($ Thousands)
Financial Highlights, Condensed Statement of Financial Position, (Unaudited), as of March 31, 2012. (Unaudited). The table contains amounts in thousands of dollars. Read down the first column for categories: total net liabilities, total net financial assets, departmental net debt, total non-financial assets and departmental net financial position. The second column indicates the change in dollar amounts. The third and fourth columns indicate the financial amounts for 2011-2012 and 2010-2011.
| blank |
Change
$ |
2011-12 |
2010-11 |
| Total net liabilities |
-7,655 |
21,632 |
29,287 |
| Total net financial assets |
-2,943 |
10,853 |
13,796 |
| Departmental net debt |
-4,712 |
10,779 |
15,491 |
| Total non-financial assets |
-1,747 |
4,577 |
6,324 |
| Departmental net financial position |
2,965 |
-6,202 |
-9,167 |
Condensed Statement of Operations and Departmental Net Financial Position (Unaudited)
For the Year Ended March 31, 2012
($ Thousands)
Condensed Statement of Operations and Departmental Net Financial Position (Unaudited) for the Year Ended March 31, 2012. The table contains amounts in thousands of dollars. Read down the first column for the categories: total expenses, total revenues, net cost of operations before government funding and transfers, departmental net financial position. Read to the right and down for the percentage change for each category. Read to the right and down for the financial amounts for 2011-2012 and 2010-2011.
| blank |
Change
% |
2011-12 |
2010-11 |
| Total expenses |
-4 |
132,970 |
139,007 |
| Total revenues |
1 |
72,405 |
71,695 |
| Net cost of operations before government funding and transfers |
-10 |
60,565 |
67,312 |
| Departmental net financial position |
-32 |
-6 202 |
-9 167 |
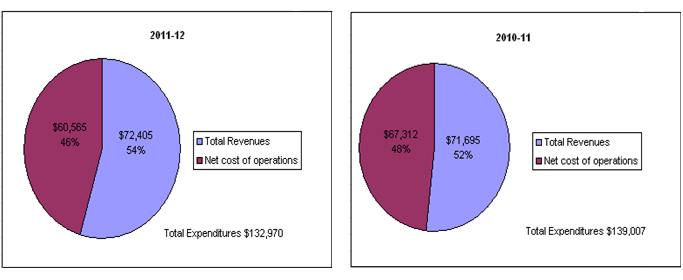
Financial Highlights – Graphs
Text version
Two pie charts illustrating the financial highlights for the years 2011-2012 and 2010-2011, respectively. Amounts are indicated in thousands of dollars.
Each pie chart is divided into two sections.
The first section represents revenues and the second section represents the net cost of operations.
In 2011-2012 total expenditures were $132,970; 54 percent or $72,405 was revenues and 46 percent or $60,565 was the net cost of operations.
In 2010-2011 total expenditures were $139,007; 52 percent or $71,695 was revenues and 48 percent or $67,312 was the net cost of operations.
Financial Statements
The financial highlights presented within the Departmental Performance Report are intended to serve as a general overview of the School's financial position. More information is available on the School's Web site More info for the financial highlights.Endnotes viii
List of Supplementary Information Tables
Electronic supplementary information tables listed in the 2011-12 Departmental Performance Report can be found on the School's Web site.Endnotes ix
Section IV: Other Items of Interest
Organizational Contact Information
www.myschool-monecole.gc.ca
- Date modified:
